YouTube Analytics Quick Start Guide for New YouTubers [2023]
A quick start guide for every new YouTubers. Start using data in YouTube Analytics as your best weapon to create the next best content.

About the Author
Growth @ Slip.stream. Covers topics of creator economy, and music rights.
YouTube Analytics provides content creators with a wealth of information about their videos and audience. With almost 80 metrics across 14 categories, it can be overwhelming to know where to start. Don’t be intimidated by looking at numbers or crunching the data - this article help you quickly get a handle on what and where to look in YouTube Analytics.
If you're a new YouTuber looking at YouTube Analytics for the first time, there are two areas you should focus on:
- Performance by content - Here you can find the detailed data by content
- Individual content performance. Deep dive into the individual video.
Performance by content
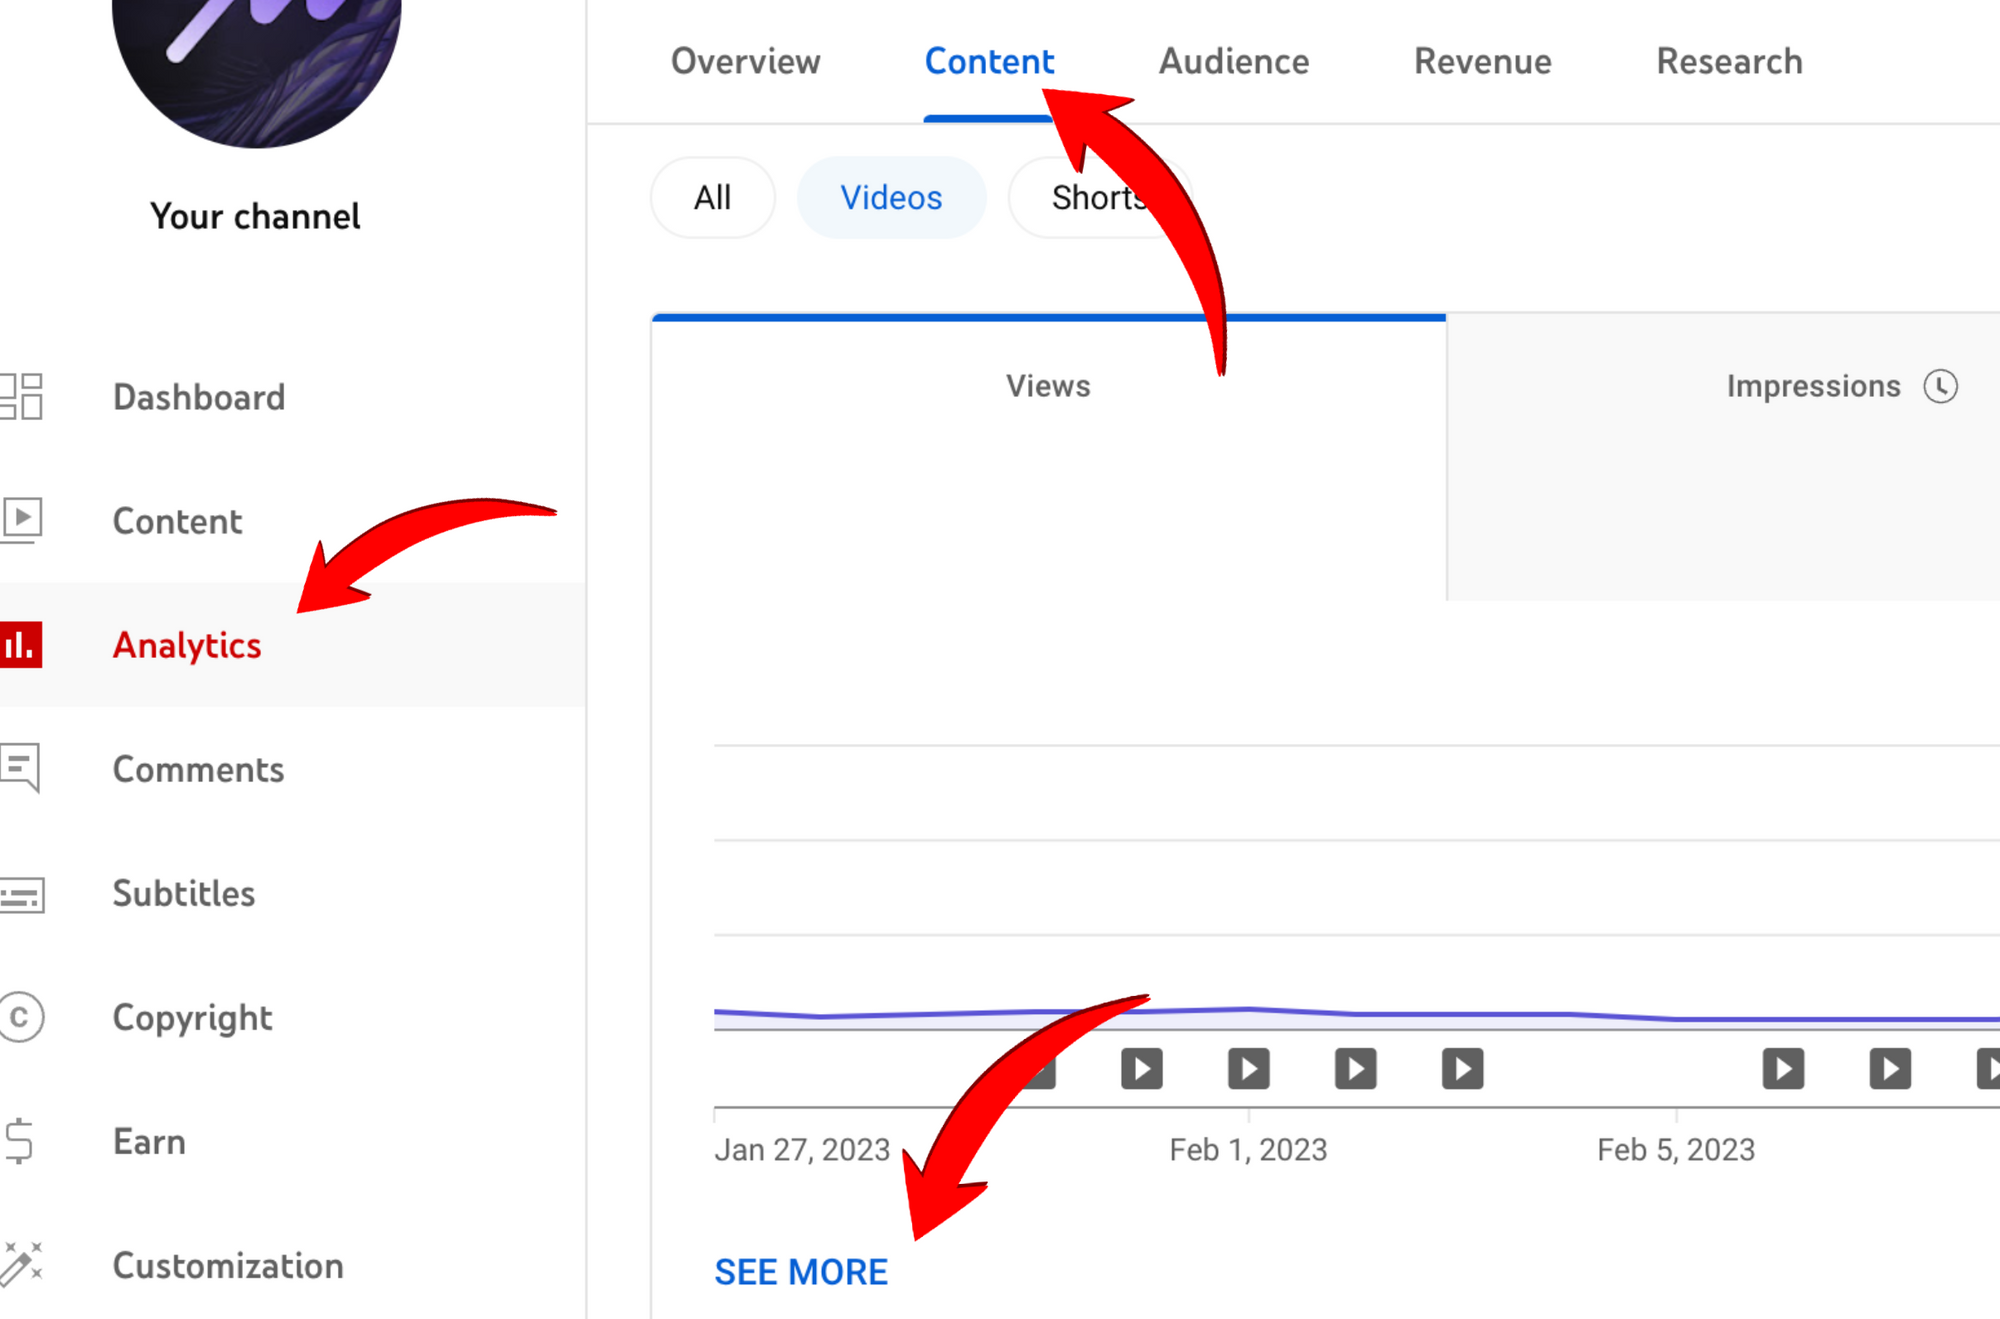
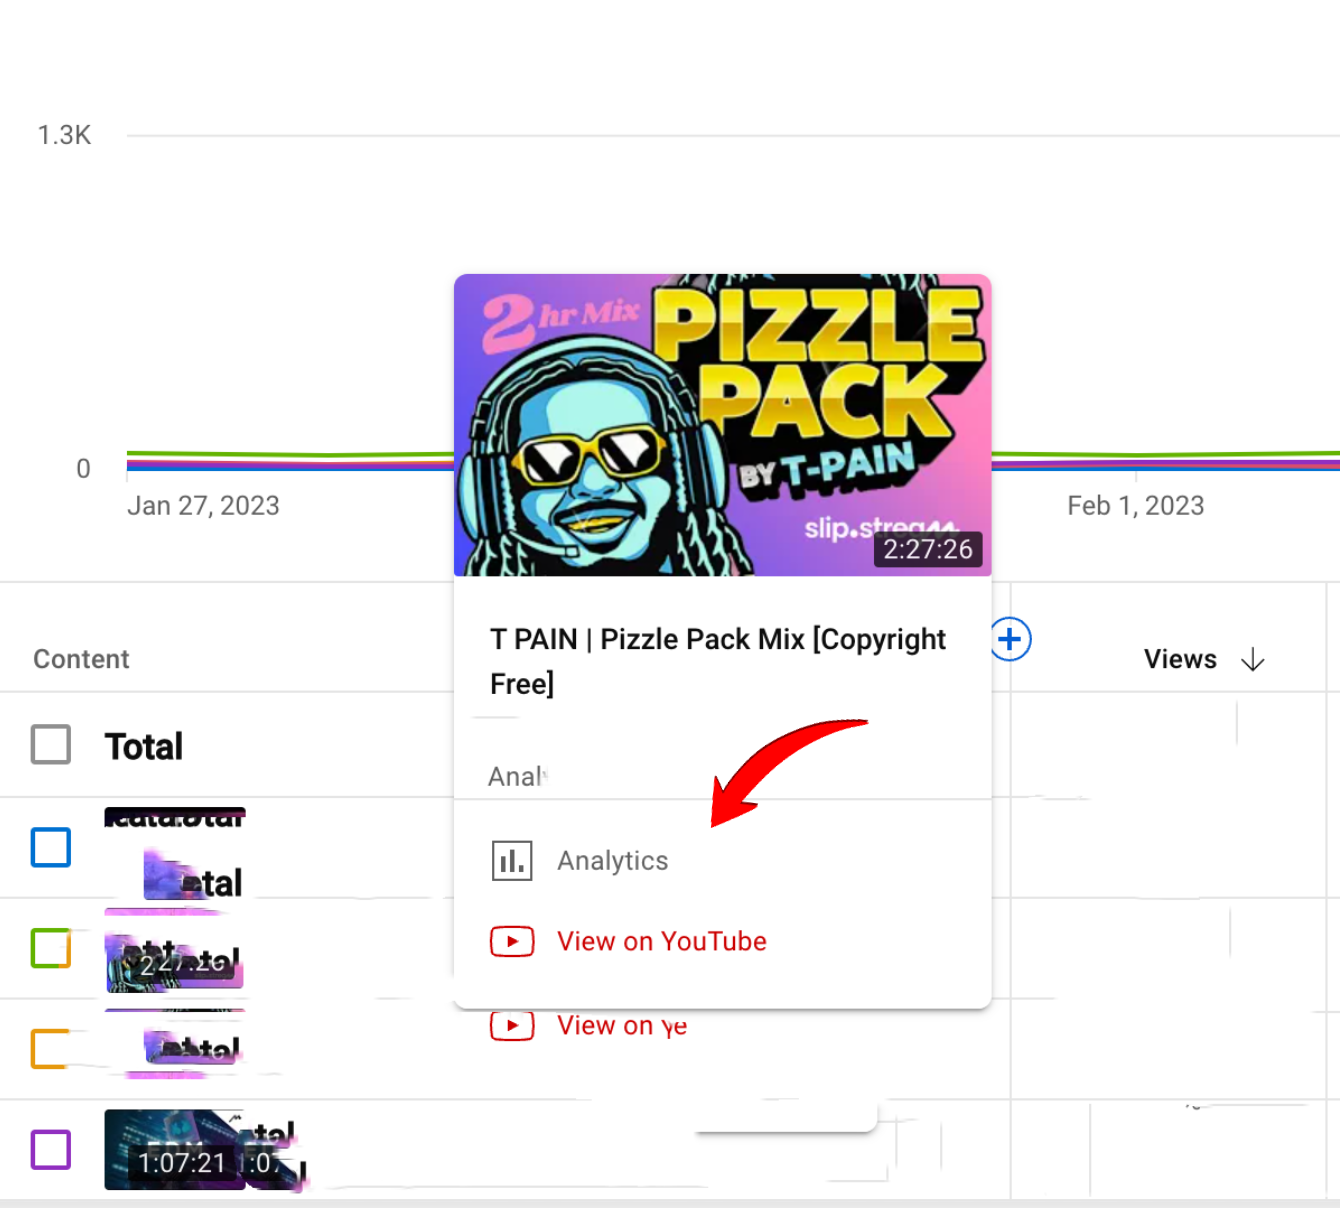
To access your performance by content report, simply click on "Analytics," then "Content," and finally "Learn more" after signing into YouTube Creator Studio.
Impressions, views, click-through rate
This set of metrics evaluates the overall reach of your videos, with the ultimate objective being to increase views through better content, regardless of the creator's size. Impressions denote the number of times your thumbnails are displayed, while views indicate how many times your videos have been watched. Click-through rate (CTR) is the ratio between impressions and views.
How can you act on this group of metrics?
Find commonalities on the titles and thumbnails that have the highest CTR.
We want to pay attention to CTR (click-through rate) and it directly relates to
- the level of interest of the audience to the content
- how effective is the thumbnail and title
These videos may not have the highest number of views or impressions, but their titles and thumbnails are definitely resonating with the audiences they are being shown to. For example, do these videos share common elements like numbers in their titles, or are they related to a recent event? What keywords do they have in common? However, it's important to rule out videos with only a few impressions, as this can skew the click-through rate (CTR) and lead to unreliable conclusions.
Analyze the topics of the content that has the top impressions.
The number of impressions represents from YouTube's standpoint how likely a video is going to satisfy the viewers. Looking at what topics these videos are talking about gives you better insights into what topics to develop next.
Average percentage viewed, likes, dislikes and shares
This group of metrics shows how much the audiences like the content once they start viewing it. It is recommended to look at the average percentage viewed rather than the average view duration as it is comparable among videos of different lengths.
How can you act on this group of metrics?
You need to specifically watch out for videos that are high in CTR but low in average percentage viewed, as the algorithm will consider the thumbnail or title to be misleading or serving as clickbait, thus getting recommended less.
Also, what are the videos that are getting likes or comments; Does asking the viewers to give you a thumbup make a difference? What videos get more comments (besides the comments your mom leaves) and why would that be?
Individual content performance
The most crucial piece of information you need to know about your individual content creation is the retention, which shows how viewers are dropping out throughout the video. Typically, views tend to decrease gradually as the video progresses. As average view duration is among the key signals for the YouTube algorithm, it's essential to understand how well your video is retaining viewers to maximize views.
Still watching after 30s
This metric is currently not available in the general report as of February 2023. It is a valuable indicator of how many viewers are still engaged with your video at the 30-second mark. By comparing this metric across your videos, you can identify which videos are able to capture and retain viewers' attention effectively.
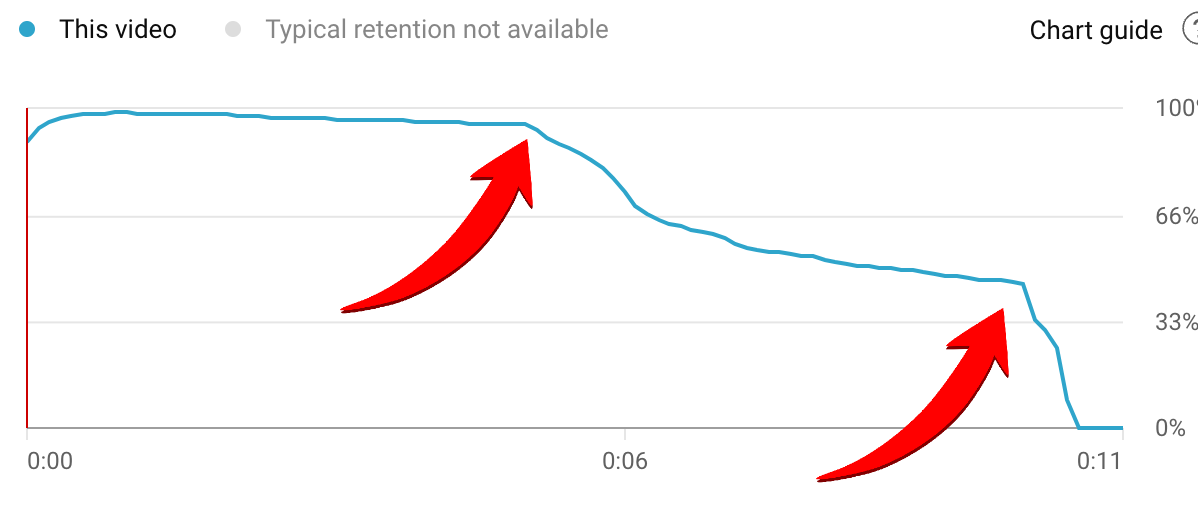
Retention graph
Retention graph shows how long viewers are staying engaged with your video, and as creators, we should strive for a smooth retention graph that is close to being flat. It's important to watch out for any significant drop-off points in the graph, as this indicates where viewers lost interest and decided to stop watching. Additionally, analyzing the content leading up to the drop-off point can provide insights into what caused the disinterest and how it can be improved.
YouTube algorithm is not the boss, but viewers are.
The YouTube team often reminds creators that viewers are ultimately in charge, not the algorithm. YouTube Analytics provides a window into what your "bosses" - your viewers - are saying.